S&P Capital IQ NetAdvantage: New Name, Content, and Interface!
September 14, 2017
Introducing the new and improved NetAdvantage database!
The Standard and Poor's NetAdvantage database has a new name, more content, and a refreshed interface. Now called S&P Capital IQ NetAdvantage, the database presents with a dashboard view that may be familiar to regular users of the full version of the Capital IQ database offered at the Trading Room. But, please don't confuse S&P Capital IQ NetAdvantage with the full version of Capital IQ - they are two different resources! S&P Capital IQ NetAdvantage retains the same key S&P resources our users have come to rely on (e.g. industry surveys and stock reports), but brings new research content and tools. Key features retained from the old NetAdvantage database:- Industry Surveys for more than 40 industries are still available, and we now have expanded access to international surveys for selected industries. The surveys continue to be published 2x per year and their format remains the same, but you will notice that they are now called CFRA Industry Surveys. Archived surveys are available back to 1999 unless a survey is a new title. There are two ways to retrieve an industry survey:
- click the [Industry Surveys] button in the top menu, then choose from the list of industries
- search for a company to retrieve the company profile, then click [Industry Surveys] in the left navigation bar to retrieve the relevant industry survey
- Stock Reports also continue to be available, but are now found in the Equity Research section of a company profile. When viewing a company profile, click [Equity Research] in the left navigation bar, then select the CFRA Equity Research Report.
- expanded company universe of private and public companies (over 3 million)
- new investment research from third party research providers (when viewing a company profile select "Investment Research"; also available under the "Investment Research" tab)
- new industry data sets with benchmarks and key ratios (available under the "Markets" tab)
- new drill-downs to sub-industry data, including key stats and ratios and financial operating metrics (available under the "Markets" tab > "refine industries")
- financial data items with new embedded audit trails to see how an item is derived
- new chart builder tool
- any screen can now be downloaded to Excel, Word, or as a PDF
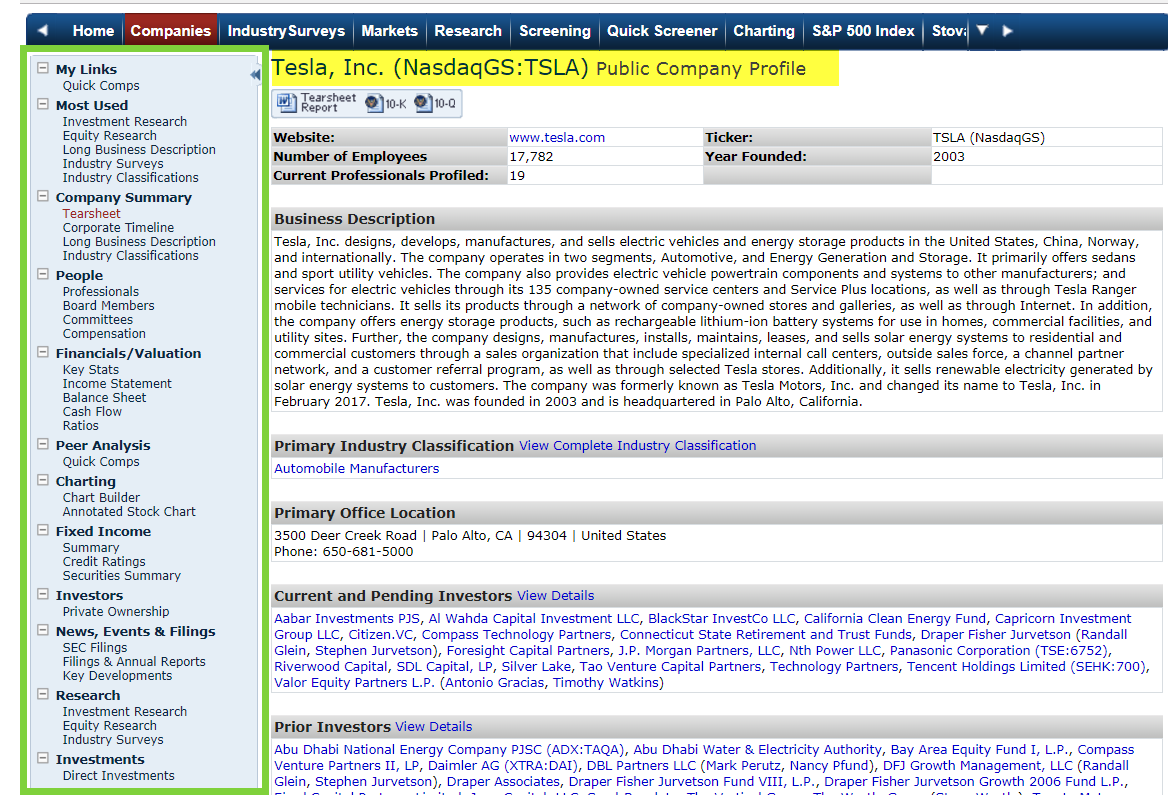
- Start by using the search box to retrieve a company profile for Tesla. Note the navigation links on the left side of the screen to additional research, including equity research, investment research, industry surveys, financials, peer analysis, and news.
 Company profile for Tesla, Inc. Click to view larger image.[/caption]
- To retrieve Tesla's stock report, click [Equity Research] in the left navigation bar, then select the Tesla, Inc. CFRA Equity Research Report.
 CFRA Stock Report for Tesla. Click to view larger image.[/caption]
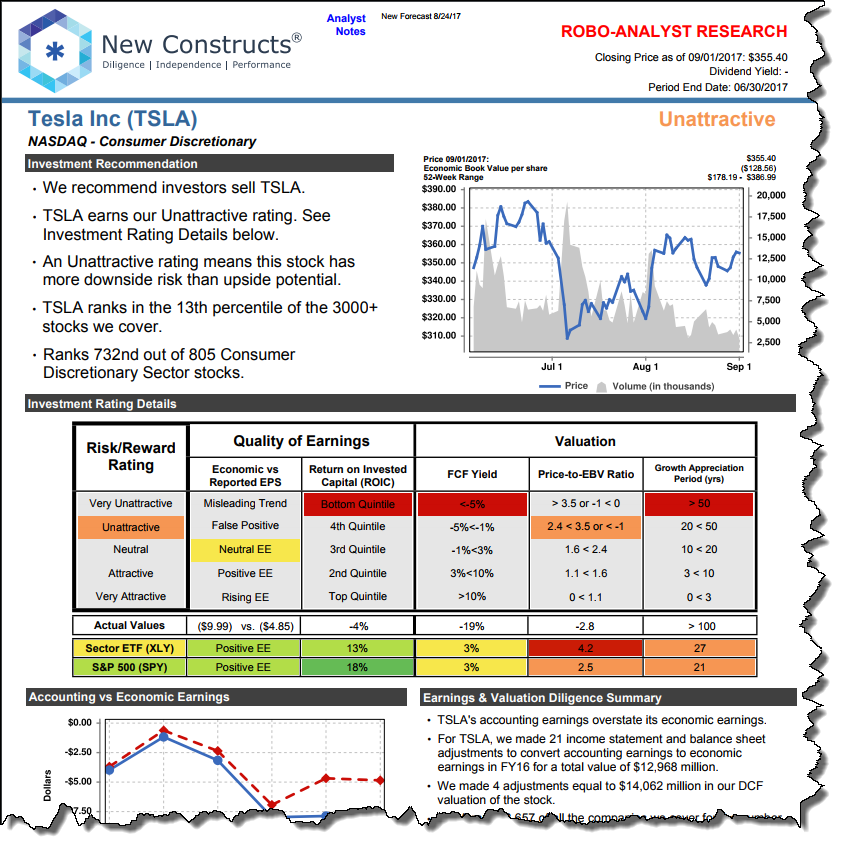
- To find additional analysis from brokerage firms click the link to the [Investment Research] section.
 Investment research report for Tesla. Click to view larger image.[/caption]
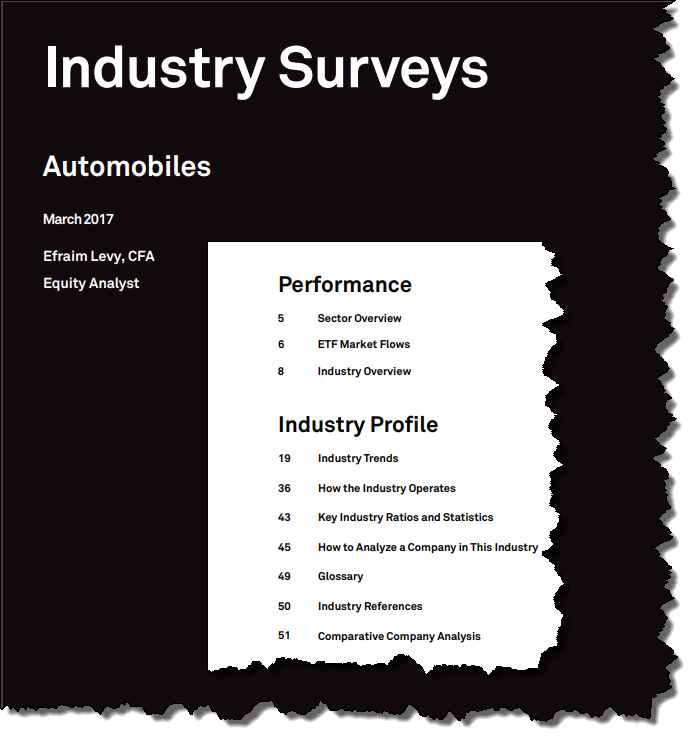
- Research Tesla's industry by clicking [Industry Survey]. Select the CFRA Industry Survey.
 CRFA Industry Survey for Automobiles[/caption]
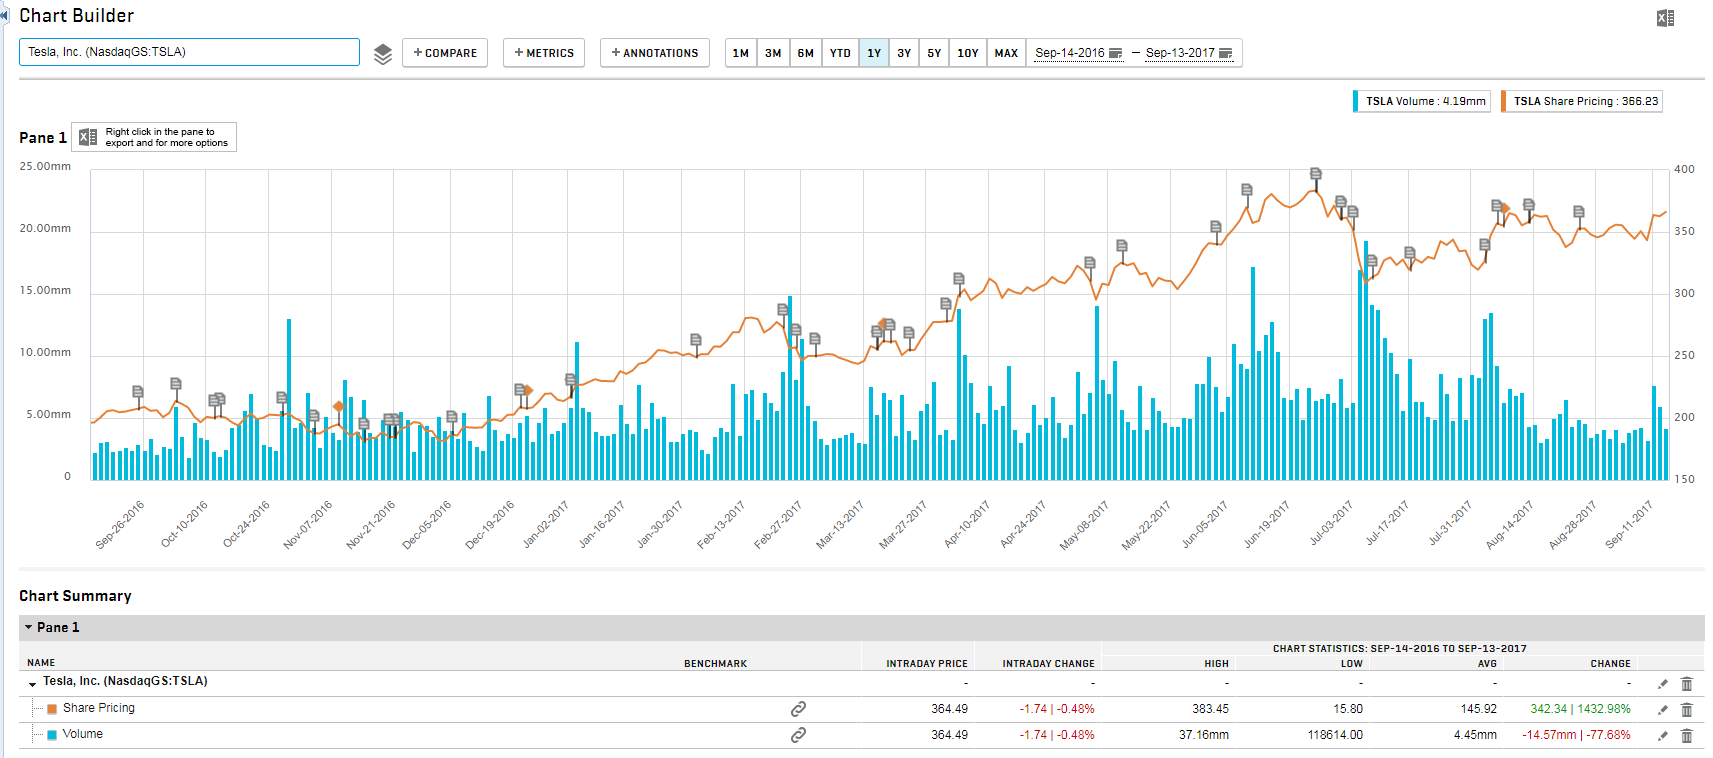
- Build a chart for Tesla. Customize the time period/date range, choose metrics, and add annotations if desired (e.g. filings, announcements, distress indicators, etc.). The "Compare" feature enables you to compare additional entities against your primary entity. Watch this chart builder video tutorial for more information about using chart builder.
 Tesla stock price and volume with annotations for filings and transactions.[/caption]
How to Access
Access S&P Capital IQ NetAdvantage from the library’s Databases A-Z page.
Get Help
On any screen, select [Help] in the top right corner to learn more about that feature of the database. If you have questions or would like additional help, please contact the Reference Desk.
———————————————
Database of the Month provides a very brief introduction to a useful website or Library database, highlighting key features you should know about. If you would like more information about this resource (or any of the library’s databases), please contact us for research assistance. If you would like a demonstration of this resource for a class, please schedule a research instruction class using the instruction request form.
